Overplot of Kp values:
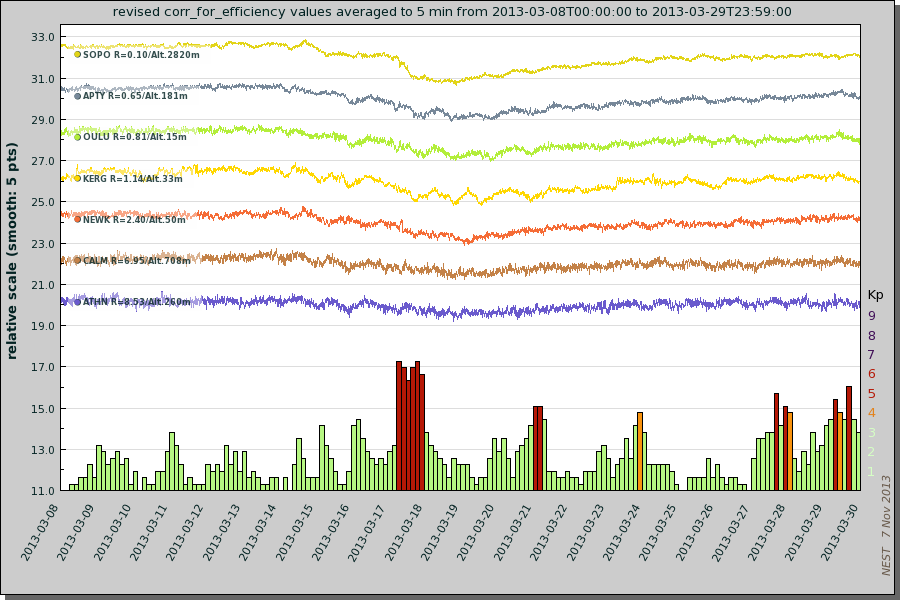
How to get this plot:
- select some stations
- select from 08/03/2013 to 29/03/2013 in the date selection area
- select force and best in the time resolution area
- select 5 in the smooth width area area
- select Kp 3-hourly index in the Overplot Kp / Ri area (!maximum of 1 year!)
- Other parameters are set to the default values
Overplot of Ri values:
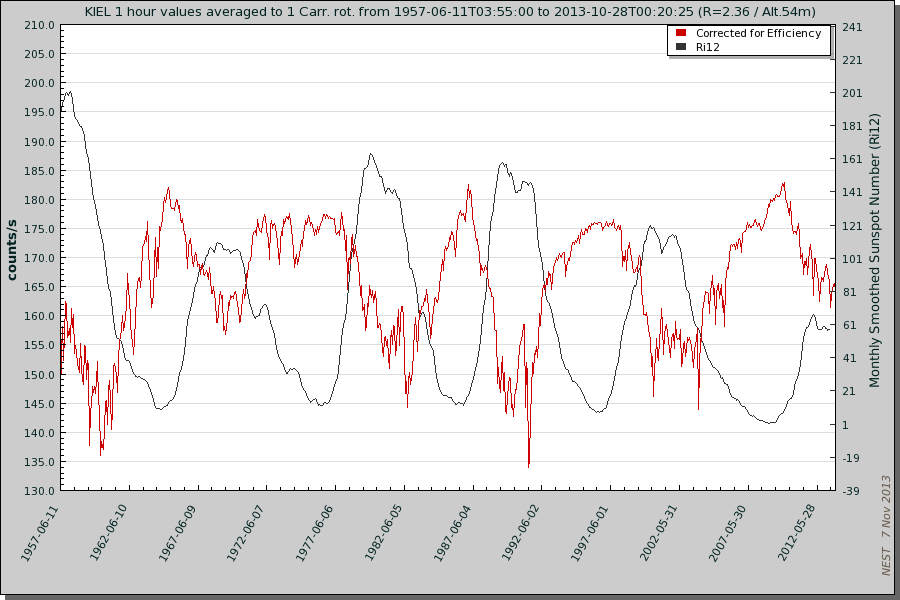
How to get this plot:
- select KIEL station and change its color to red
- select from 01/01/1957 to current date in the date selection area
- select counts in the scale area
- select Smoothed sunspot number in the Overplot Kp / Ri area
- change the color of the Ri plot in the same area
- specify your own Yscale in the scaling options area: min 130 and max 210
- unselect Show mean line in the syle options
Overplot of GOES Proton values:
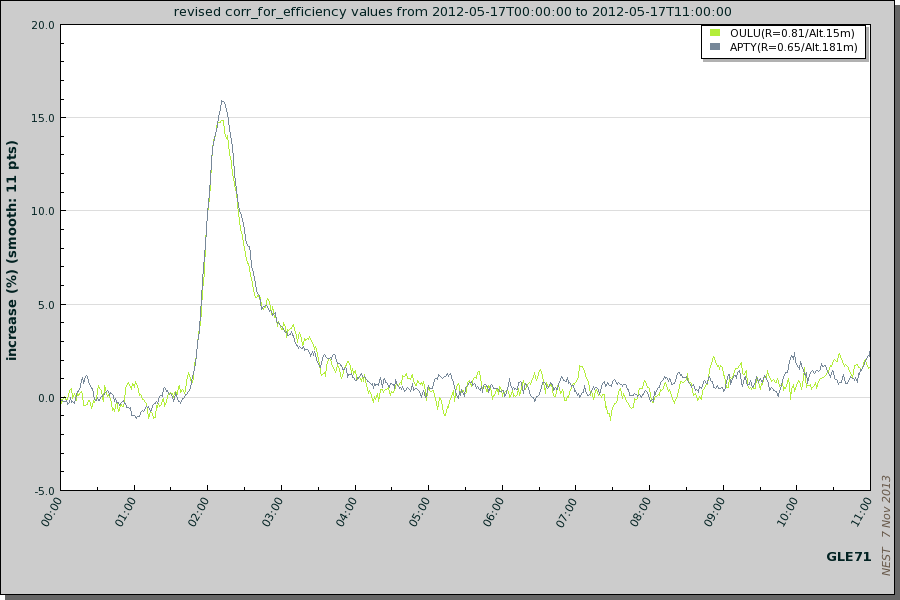
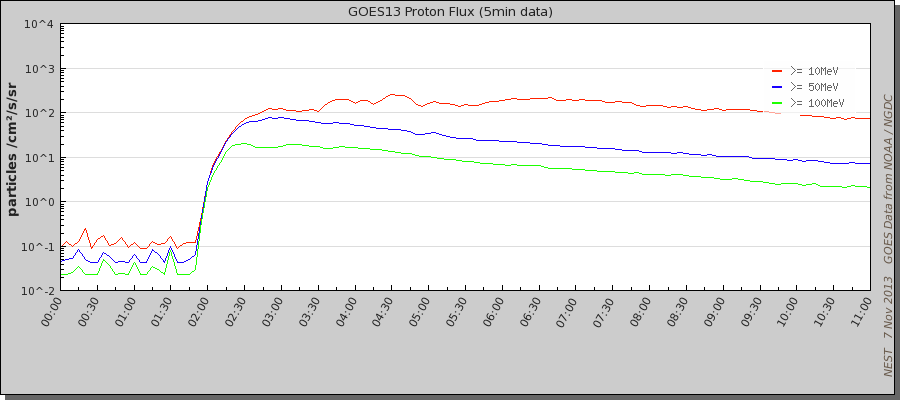
How to get this plot:
- select APTY and OULU stations
- select GLE71 in the date selection area
- select 10 in the smooth width area
- select GOES13 proton plot in the GOES proton plot area
How to get this plot:
- select APTY and OULU stations
- select GLE71 in the date selection area
- select 10 in the smooth width area
- select GOES13 proton plot in the GOES proton plot area