|
|

|
||||||||||||||||||||||||||||||||||||||||||||||||||||||||||||||||||||||||||||||||||||||||||||||||||||||||||||||||||||||||||||||||||||||||||||||||||||||||||||||||||||||||||||||||||||||||||||||||||||||||||||||||||||||||||||||||
|
SOLAR CYCLE The sun is a star which magnetic field varies with time. The sunspots, which are regions with strong magnetic fields, provide an easy way to follow the 11-year solar activity cycle variations.  The sunspots and their groups are counted in many observatories and an index, called sunspot number (or more properly sunspot index) is derived by the Royal Observatory of Belgium SILSO service from the collected observations. The cycle duration varies from 9 to 14 years, 11 years being the average as shown in the following tables which gives values of the RI12 index(*). The sunspots and their groups are counted in many observatories and an index, called sunspot number (or more properly sunspot index) is derived by the Royal Observatory of Belgium SILSO service from the collected observations. The cycle duration varies from 9 to 14 years, 11 years being the average as shown in the following tables which gives values of the RI12 index(*).Almost all the solar features are directly or indirectly related to the solar cycle. Indeed the solar magnetic field structures the entire solar atmosphere and, as a consequence, the interplanetary medium. Thus the solar cycle also modulates number of solar-terrestrial effects. Prediction of the cycle of sunspot numbers are of prime importance for most of the Space Weather applications. It is strongly needed for telecommunications and satellite orbitography because the solar flux in the UV, EUV and X-ray ranges, which is partly emitted in magnetic loops located above solar active regions, is highly correlated to the sunspot number. Radiation belts characteristics (and their impact on satellite electronics) are also solar cycle dependent, as well as atmospheric chemistry (and its impact on satellite surfaces). Because solar flare and coronal mass ejection frequencies are closely related to the sunspot cycle, applications involving solar particles (radiation dose received by astronauts and by satellite electronics for example) are demanding long term sunspot cycle predictions. Finally solar sunspot cycle prediction is used to predict cosmic ray intensity and radiation doses received by air crews, because of the galactic cosmic ray modulation by heliospheric magnetic field (see modulation parameters). To learn more about the solar cycle, you can read the following chapter:  (pdf, 314 Ko, in french) (pdf, 314 Ko, in french)
(*) In july 2015 the SIDC changed the way the RI12 index is computed (more details on SILSO website). As a result, minimum and maximum values of current and past cycles where shifted to significantly higher values (cycle duration average remains almost unchanged). Previous values of the RI12 can be found in the following table: 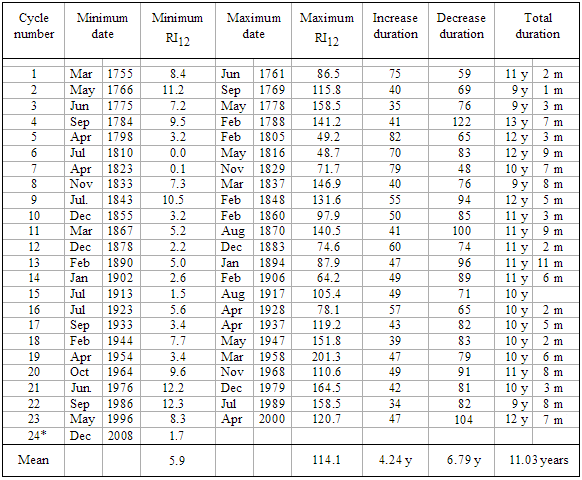 | ||||||||||||||||||||||||||||||||||||||||||||||||||||||||||||||||||||||||||||||||||||||||||||||||||||||||||||||||||||||||||||||||||||||||||||||||||||||||||||||||||||||||||||||||||||||||||||||||||||||||||||||||||||||||||||||||||