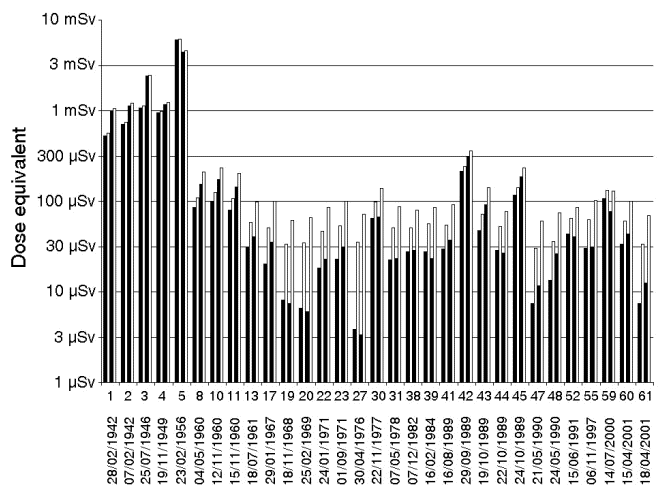
Bar chart of the dose equivalents received in the worse case during GLEs, calculated
with the model SiGLE. Each group of four bars corresponds to a given GLE (number and date are
indicated along horizontal axis). The first pair shows dose equivalents for Paris-New York flight
on-board Concorde (GLE contribution in black, total dose in white). The second pair shows dose
equivalents for Paris-San Francisco flight on-board Airbus A 340.


