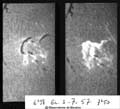
 amount of energy. These phenomena, called solar flares, are observed in optical spectroscopic lines (in particular the Hydrogen line called Hα ), in X rays, UV and radio ranges and more rarely in gamma rays and in optical continuum. The following example was observed in Hα at Meudon Observatory in 1957. amount of energy. These phenomena, called solar flares, are observed in optical spectroscopic lines (in particular the Hydrogen line called Hα ), in X rays, UV and radio ranges and more rarely in gamma rays and in optical continuum. The following example was observed in Hα at Meudon Observatory in 1957.Small solar flares (class 1) are rather frequent: about a hundred flares per month at the time of the cycle maximum. Large flares producing disturbances of terrestrial environment are only a few per year. Their effects are due either to X ray and UV enhancement (sometimes by a factor 1000 compared to the quiet sun radiation), to the protons accelerated at the sun and/or in the shock waves related to the flare, or to the disturbance of the solar wind induced by the flare. The flare can be associated with a CME (Coronal Mass Ejection) which can be well observed by coronographs like Lasco flying on-board Soho (SOlar and Heliospheric Observatory). To learn more about the solar flares, you can read the following chapter:  (pdf, 345 Ko, only in french at the present time) (pdf, 345 Ko, only in french at the present time)QBSA data The flares are monitored in the Hα line by number of observatories. A synthesis of the observations of all the observatories has been made at Paris-Meudon Observatory since 1935 and has been published up to 1989 in a publication of the International Astronomical Union called Quaterly Bulletin of Solar Activity (QBSA). A break in the twin publication of the Meudon Observatory "Synoptic Charts of Solar Activity" has stopped the publication of the synthesis of Hα line observations of flares in QBSA. The QBSA is available on the Nobeyama Radio Observatory site as Gif image files scanned from the paper edition. Hα flare activity is covered from 1977 to 1989. Nevertheless, as the data from 1972 to 1989 have been digitally saved, we make it available here to facilitate the use with computers. Two kinds of annual files are given: the main files are lists of flares (description). The other files give the time periods without observations (description), which are necessary to interpret correctly the corresponding flare list. More recent Hα flare data are available on the Solar Geophysical Data web site but for a smaller number of observatories.
| |||||||||||||||||||||||||||||||||||||||||||||||||


